Pokémon Slice n' Dice 🔪
Goal
With this project, I wanted to showcase that with a bit of creativity, you can use different software in an unorthodox way while still maintaining its intended use. Here, I tried to demonstrate that although Microsoft Power BI is generally used as a program to visualize data into graphs, and charts, you could use it for something similar, yet different.
Overall, I think showcasing data in this way makes it more appealing, and honestly, just fun. It helps give character to data, instead of just simply being numbers focused.
Data Sources
I got the original data set from Kaggle, but it didn't have everything that I needed. In particular, it was lacking images for the Pokémon and their types, the 3D animated models, and their Pokédex descriptions. For +90% of the images, I used an excel formula to easily insert them into the spreadsheet based on their URL, however for some I had to do it manually.
Additionally, it was missing some key fields that I wanted to include, like the evolution type, and regional variants. I was able to use some excel formulas to save time wherever I could, but for many they also had to be done manually.
Although the stats were available for most Pokémon, I still needed to make some adjustments, as some fields weren't calculated. For example, in order to display each Pokémon's weaknesses, and resistances, I had to figure out an excel formula to use.
Pokémon Card Slicer
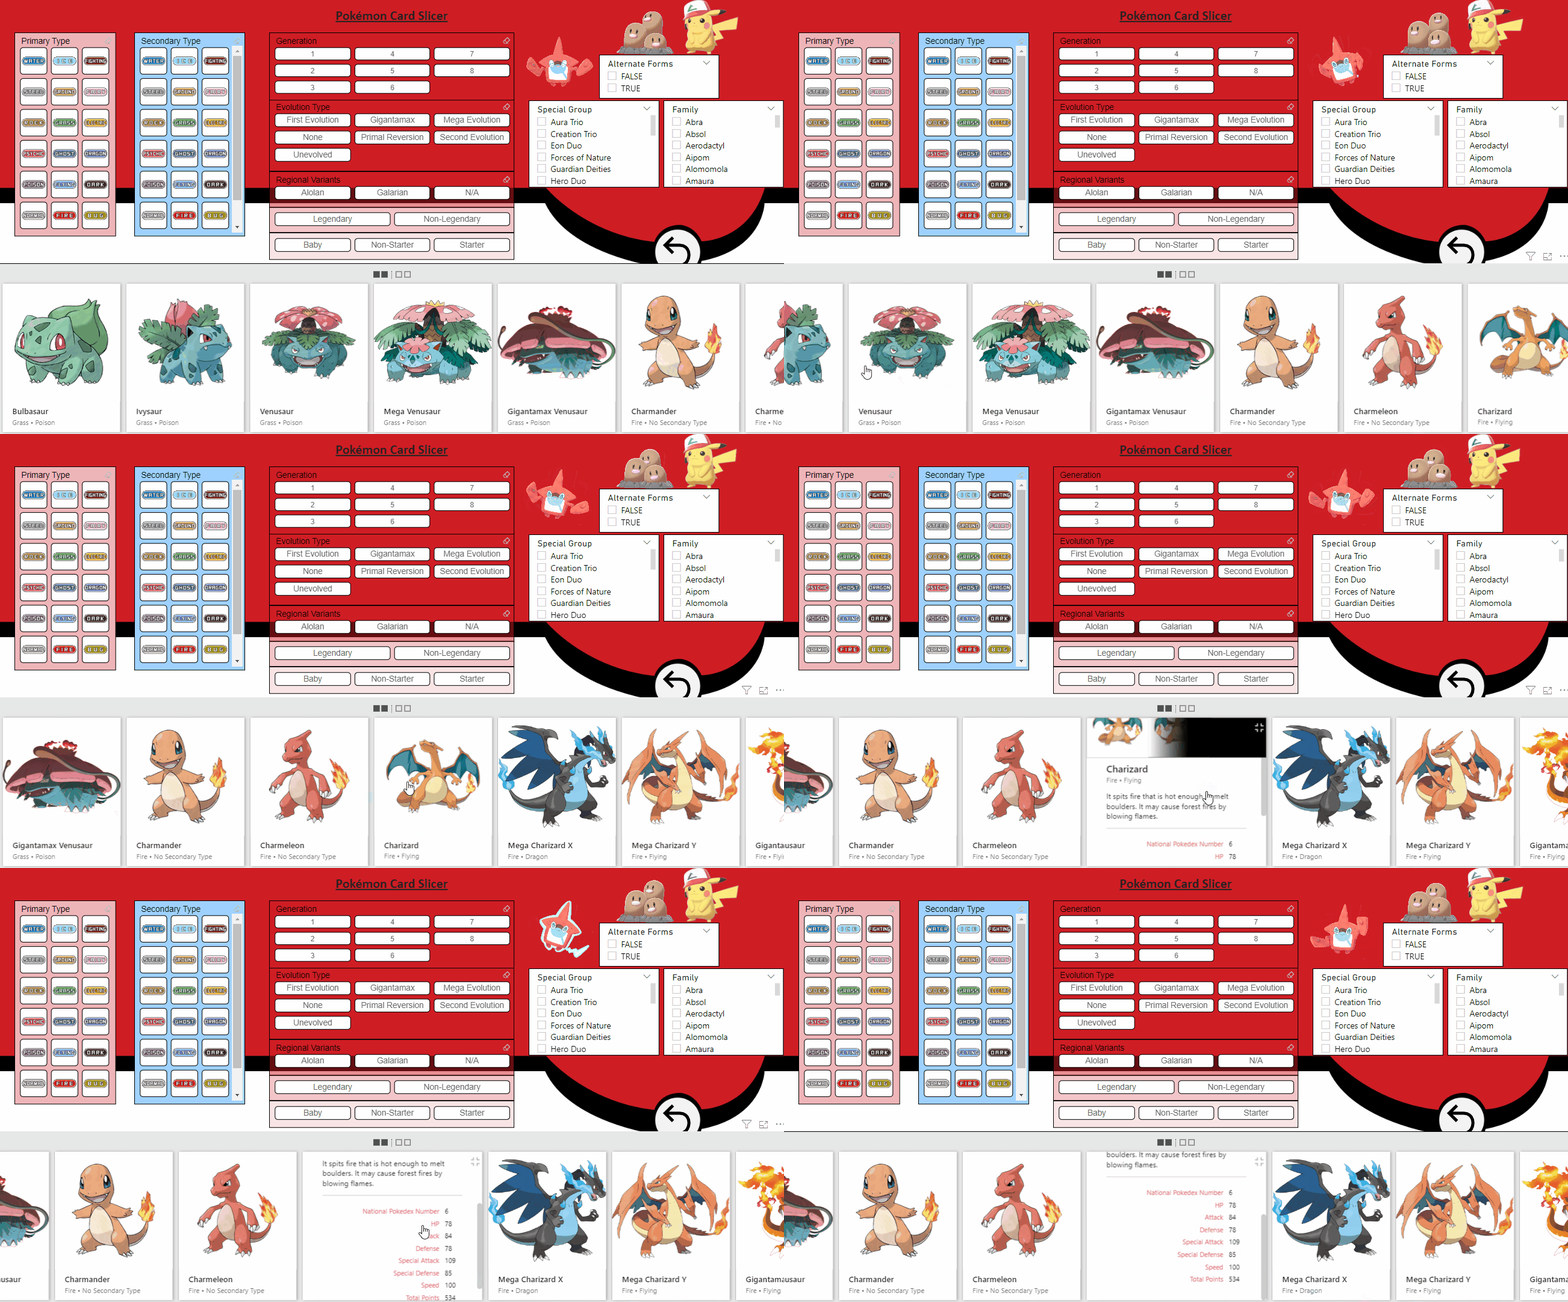
Alright, now for the fun stuff. I was experimenting with ways to best emulate an actual Pokédex, and I came across an add-on called Card Browser, which fit perfectly for what I was trying to achieve, and pays homage to the trading cards.
This page allows you to browse through Pokémon from generations 1 through 8 and filter on different fields such as primary and/or secondary type, whether it’s a legendary, belongs to a certain group, etc., which then displays the corresponding Pokémon cards below.
Pokédex
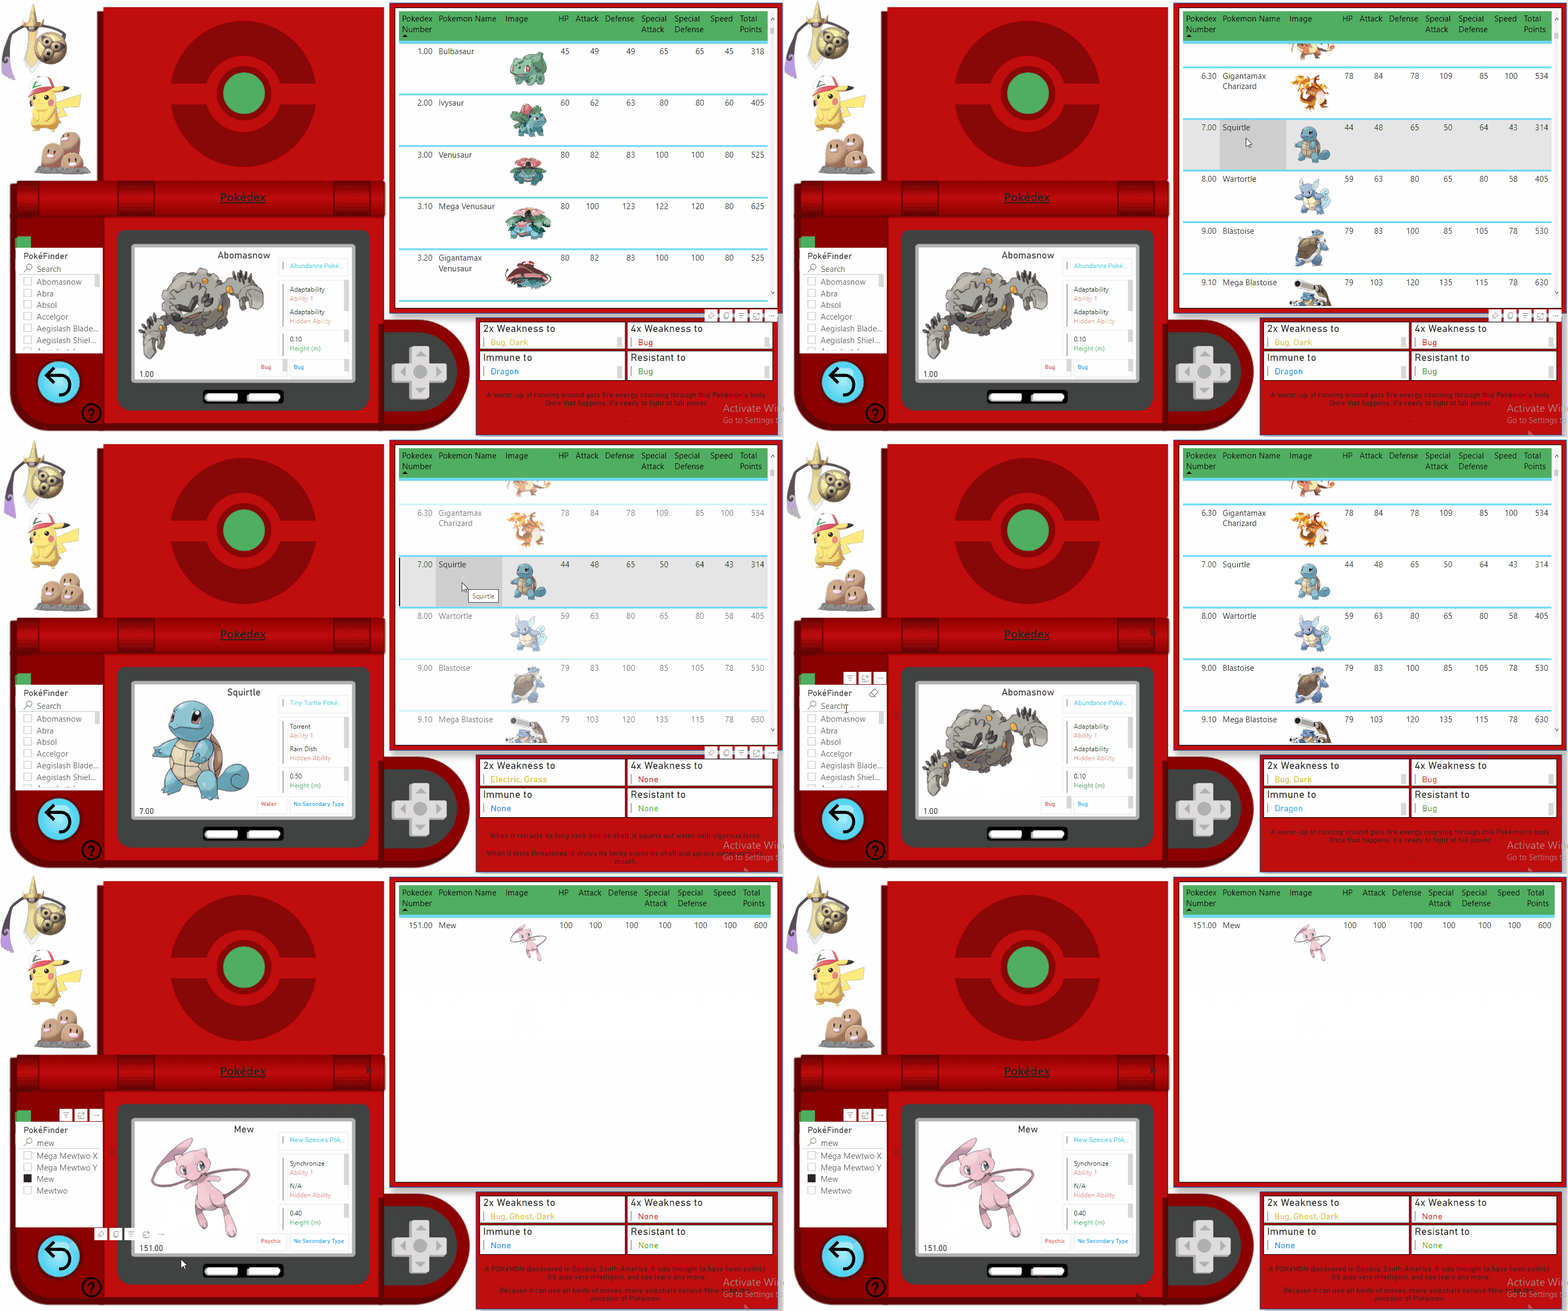
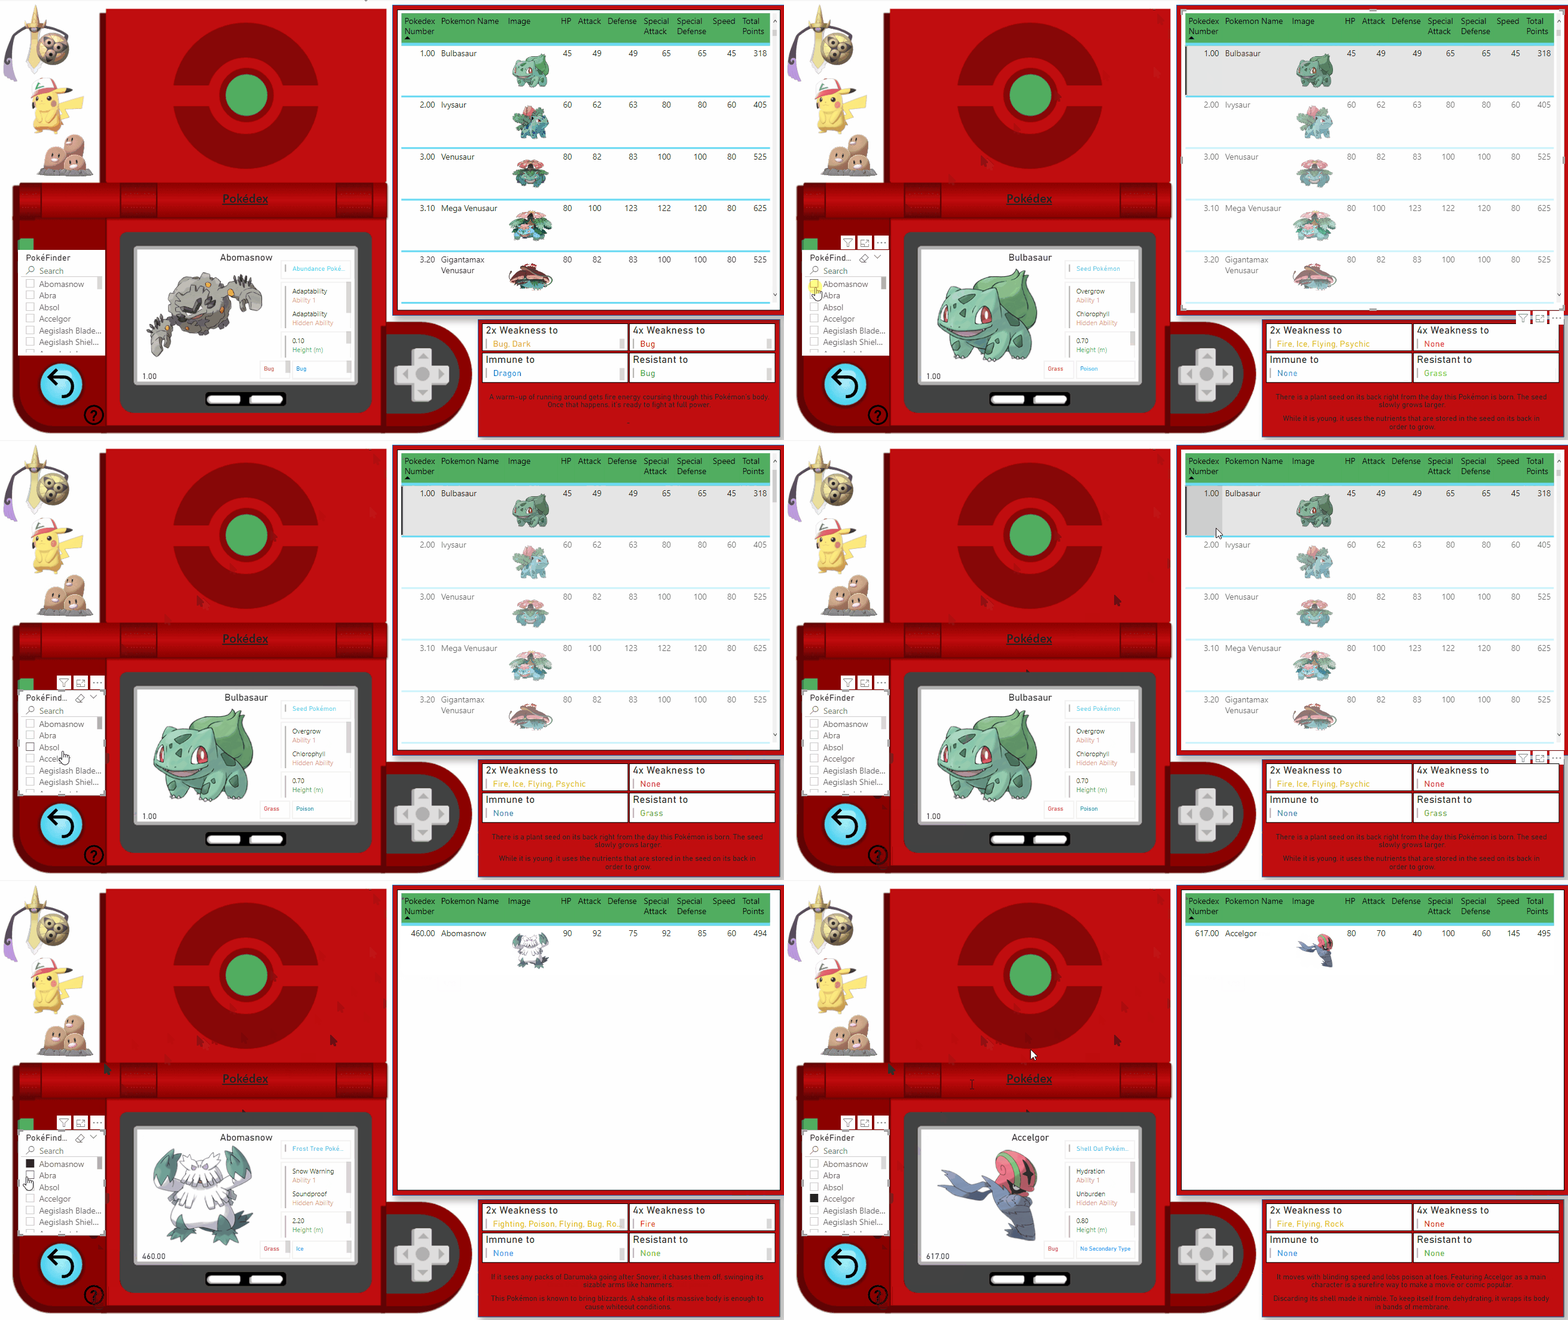
This was the page I enjoyed making the most. I included data you would find in any Pokémon game, including height, weight, typing, etc. I also added type advantages, weaknesses, abilities, and hidden abilities, which aren’t found in the Pokédex for any of the games.
On the left, you can type any Pokémon's name into the "PokéFinder" and it will bring up their Pokédex entry after selecting them.
Base Stats Comparison
This page allows you to compare the base stats between Pokémon via a bar graph. The chart at the bottom left shows you how many of each Pokémon belong to each type combination.
On the right, I included a retractable slicers panel in order to save space. You can filter like the other pages, but now you can also filter by weaknesses or resistances to different types. By using the image slicer at the bottom, you can then select individual Pokémon to compare stats more easily. Once selected, you can also see the averages for all their different stats.
For a regular Pokémon playthrough, most people don’t take team composition that much into account, however for competitive play it’s very much necessary. I personally used this to look for any gaps in my offense and defense when I was selecting my team for online competitive battles.
3D Team Builder
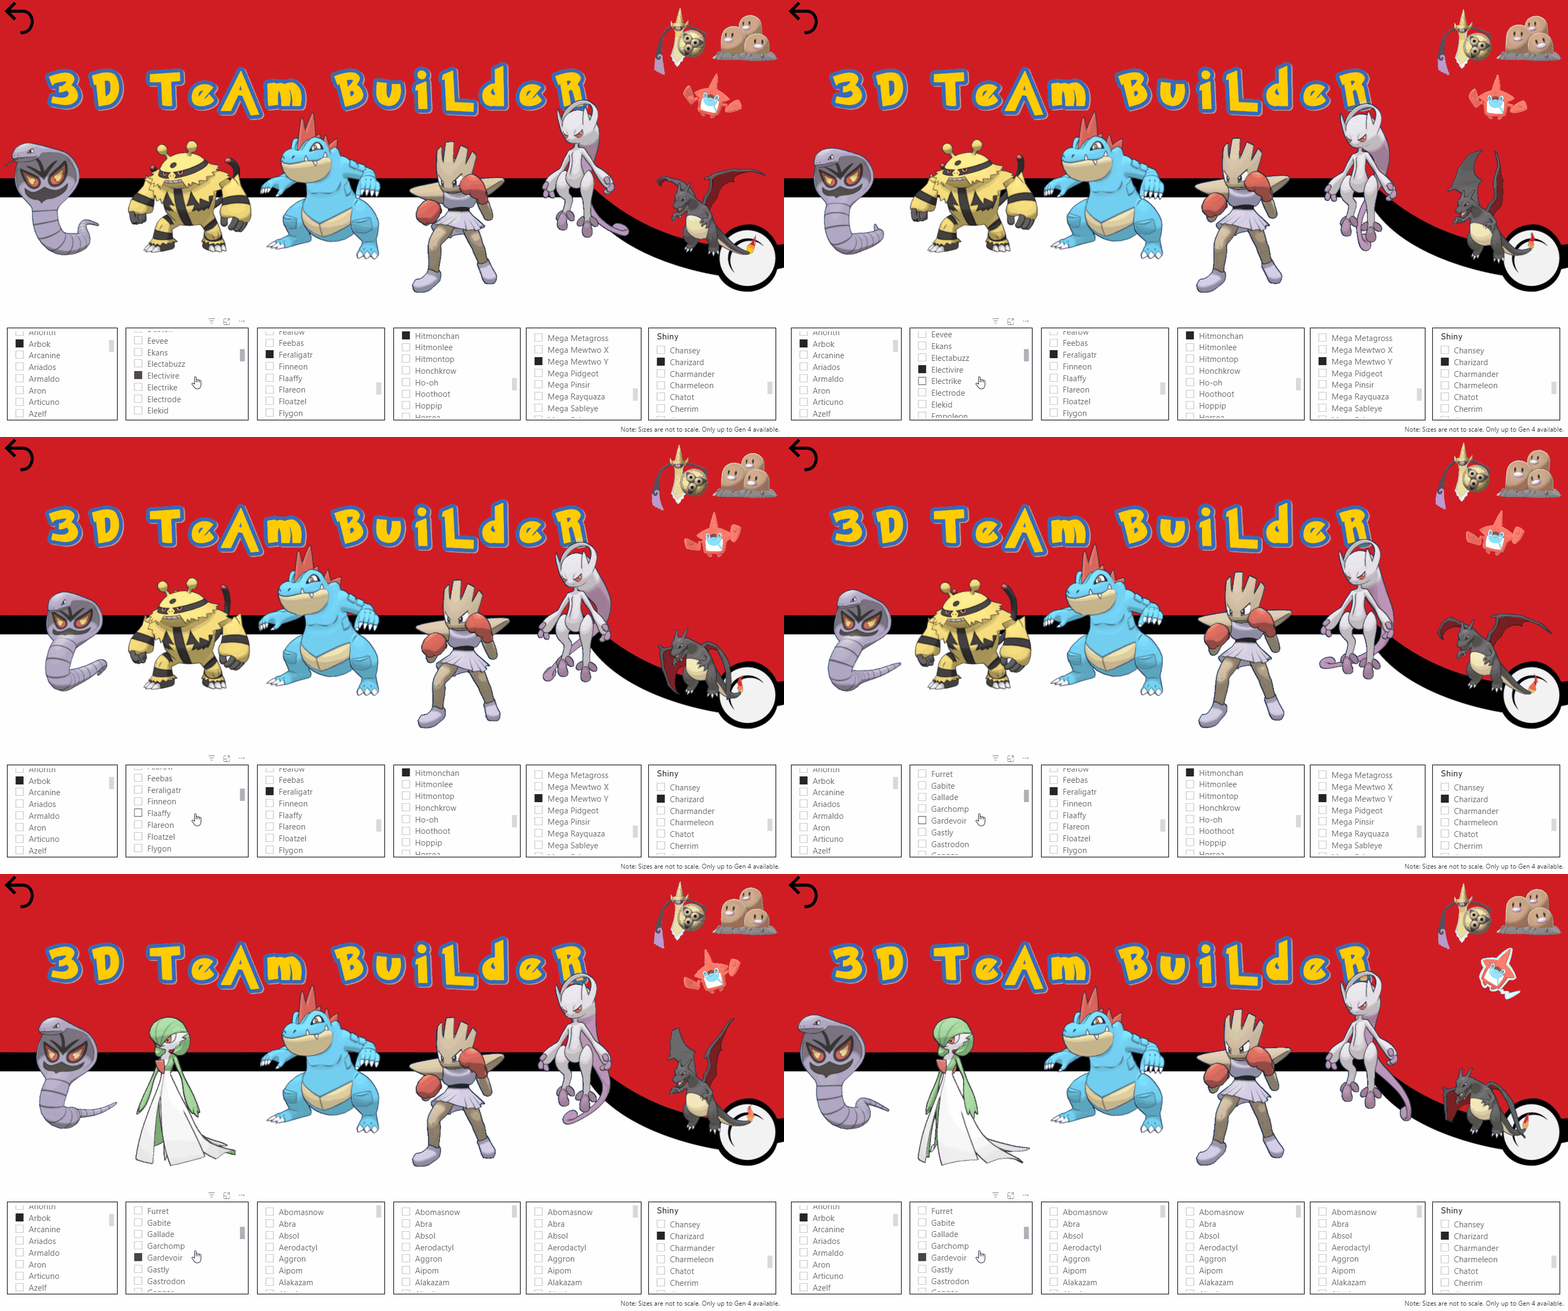
This was honestly just initially included, because I thought it looked cool. However, when I was starting my playthrough of Pokémon Shining Pearl, I thought to myself, “I wonder how this team would look?” So, I opened up my BI report, and used it as inspiration. Needless to say, I took down Cynthia with style 😎
Moving Forward
I did run into some issues that could improve the overall experience. For example, for the Pokédex, on startup it shows all of the individual data in descending order, rather than starting from the first Pokémon (Bulbasaur). Also, if a Pokemon is selected on the table, then the PokeFinder would not display the data properly. I made a simple fix by including a tooltip to notify the user of this issue, and how to reset it, however, it would be more satisfying if it worked as intended. This could have been due to software limitations, or just my unfamiliarity with the program at the time.
Certain steps during this project also could've been easier if I was more familiar with processes such as web scraping. It would've saved me time manually entering data which although was easy enough, could’ve allowed me more time to fine-tune things.
Overall, I had a lot of fun making this project. It was my first time actually creating something myself in Power BI although I had used the program before. It took me back to simpler times where stress revolved around making it past Gary's Blastoise to become champion.


